


Ecommerce businesses are sitting on unfathomable volumes of customer and operational data. Serious businesses mine this data to extract actionable business intelligence and gain visibility into business performance. But intelligence may be obtained in silos, making it challenging to connect the dots between and extract maximum value from data. In fact, this is what at least 40 percent of companies across industries struggle with. This is where an advanced ecommerce dashboard can be very valuable.
An ecommerce dashboard curates key performance indicators for multiple aspects of a digital store. This analytical dashboard draws attention to clearly highlighted trends and anomalies, enabling retailers to take proactive steps to identify issues, resolve them, and further augment and optimize processes.
What can enterprises do with ecommerce dashboards, and what business value can they deliver? Let’s explore.
What is the value of an ecommerce dashboard?
Companies that use data to derive advanced insights are 8.5x more likely than beginners to report at least 20 percent revenue growth. One way to derive these insights is by curating and visualizing business-critical data through dashboards.
But insight-led revenue growth is one part of what an ecommerce dashboard has to offer. With an ecommerce dashboard, you can:
1. Get a bird’s eye view of your store’s performance and growth
With an ecommerce dashboard, you get complete visibility into the performance of your store throughout the customer journey.
Track the efficacy of your acquisition and conversion strategy, optimize inventory and fulfilment based on real-time intelligence, and let data enable you to take customer experience to the next level.
With ecommerce dashboards, your decisions become proactive and not reactive, and your business thrives.
2. Save time with visualized data available at your fingertips
Ecommerce data for every phase of the customer journey is usually spread across multiple locations. This means that intelligence is not readily available and takes effort to extract from unprocessed data. This means your business decisions slow down or worse—they become based on conjecture.

With an ecommerce dashboard, you can feed data from anywhere into your store into a central location and extract insights quickly through data visualization.
3. Identify bottlenecks and flaws in real-time and take action
System and process flaws—especially for large enterprises—can slip under your nose and wreak havoc on your store operations. This can impact customer experiences and business growth. Data monitoring can solve this, but processing and analyzing data can take a lot of time—time in which the issue can aggravate to become a bigger threat.
Through an ecommerce dashboard, you can monitor data in real-time and identify trends over specified time periods. You can also set up automated alerts for red flags in store operations and processes and investigate any bottlenecks and issues.
4. Boost profitability by tracking the right metrics at the right time
By using a dashboard to track vital KPIs in real-time, you can monitor business health in real-time, take anticipatory action to optimize processes, help your teams become more efficient, and grow your business unimpeded by threats that may plague your less data-mature competitors.
Further, the return on investment of an ecommerce dashboard—both in terms of time and money—can boost innovation and adds to the competitive edge needed to succeed in a rapidly evolving landscape.
What metrics are commonly tracked on advanced ecommerce dashboards?
Before setting-up an ecommerce dashboard, you must establish what you need it to do. Dashboards can share intelligence on the value generated by your sales and marketing efforts, the efficiency of your customer service, or the performance of your supply chain.
In our experience, CXOs and business owners prefer to have access to the big picture, and need a comprehensive store performance dashboard to provide deeper and correlated insights about business performance.
Once the objective of your ecommerce dashboard is established, you must list out the KPIs you need the interface to measure and visualize. Some common KPIs tracked on ecommerce metrics dashboards include the following.
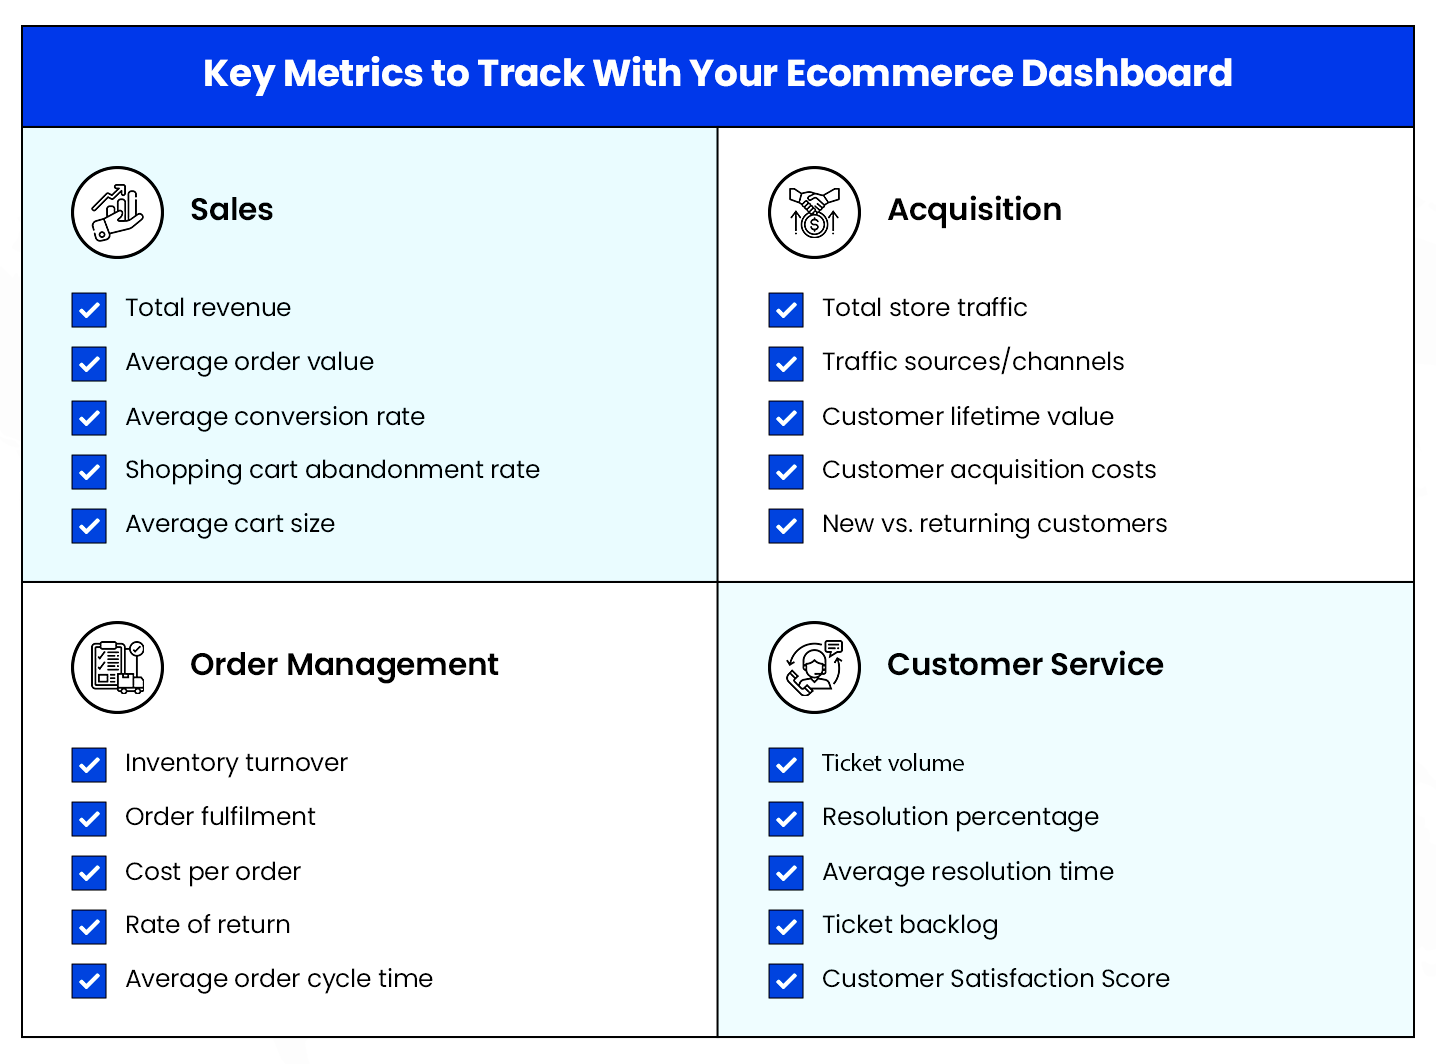
Acquisition
Bringing customers to your store is the first concrete step towards driving conversions. Your ecommerce metrics dashboard can tell you about website traffic, but it can do a lot more.
You can find out where your store visitors come from, how much it costs you to acquire them through paid campaigns, how long they spend browsing your catalogue, and a lot more with just a few clicks. Here are the acquisition KPIs you need to track to extract this information.
1. Total store traffic: Bringing people to your digital store is the first phase of the sales funnel. Your dashboard can tell you how effective your business is in doing this by showing you real-time and over time store traffic. This is akin to tracking footfall in physical stores.
2. Traffic sources/channels: Where your website traffic is coming from is an important metric to establish the effectiveness of your paid and organic marketing efforts, and can help you experiment with and improve the ROI of your paid campaigns over time.
3. Bounce rate: How many of your customers actually explore your website instead of jumping off the first landing page they see? The bounce rate metric on your dashboard can answer this, helping you evaluate the stickiness of your website and providing limited insight into potential UX concerns.
4. Customer acquisition costs: Your ecommerce dashboard can show you the efficacy of your paid campaigns. By combining information on traffic sources, ad expenses, and customers converted through paid campaigns, you can easily determine customer acquisition costs and make strategic decisions to minimize them.
5. New vs. returning visitors: How many of your customers actually come back to at least revisit your ecommerce website is the hallmark of how appealing your store and its offerings are. While not directly actionable, it is an indicator of the health of your operations.
Also Related: 20 Ecommerce Hacks to Supercharge Your Growth Strategy
Sales
How many of your store visitors turn into customers? What is the average amount they spend purchasing your products? How often do they abandon their carts? What is your monthly, quarterly and annual revenue? Your ecommerce dashboard can answer these questions by tracking these conversion metrics.

1. Total revenue: Want to know the revenue your store is bringing in a day, week, month, quarter or year? Your ecommerce dashboard can provide you with this data point within a few clicks, so you can track your business growth effectively.
2. Average order value (AOV): What is the average amount your customers spend when shopping in your digital store? Your ecommerce dashboard can find the answer, calculating the ratio of your revenue and the number of orders placed. This can help you understand your customers’ purchasing habits, and evaluate your marketing and pricing strategies.
3. Average conversion rate: Your ecommerce dashboard can compute how many of your website visitors turn into customers. It can do this by benchmarking your average conversion rate against your industry’s, helping you establish the effectiveness of your organic and paid marketing, and checkout processes.
4. Shopping cart abandonment rate: How many of your customers are putting items in their carts but not purchasing them? Your ecommerce dashboard can provide valuable insight into your store’s cart abandonment rate, indicating the potential need for checkout optimization.
5. Average basket size: This metric tracks the average number of items bought per purchase. By including this metric on your dashboard, you can better understand and segment customers and their shopping behaviors, improve inventory management, enhance sales and marketing efforts, give context to AOV trends, and much more.
Order Management
Ecommerce businesses with weak supply chains struggle to make profits. This is a predictable outcome, given the domino effect of operational bottlenecks, including an adverse effect on customer experience.
This is why supply chain visibility is a mandate for leaders that need their store to run like clockwork. An ecommerce dashboard can help by tracking these common operational KPIs.

1. Inventory turnover: Your ecommerce dashboard can tell you how strong your sales funnel is and whether you’re overstocking or understocking inventory, by computing inventory turnover. This is the ratio of the cost of goods and the average inventory over a period of time and explains the rate at which your stock is sold, used, or replaced.
2. Order fulfilment: This is a group of fulfilment-critical metrics that your dashboard can combine and display under a single tab. You can track the total order cycle time, percentage of error-free orders, percentage of orders delayed, inventory accuracy, and much more.
3. Cost per order: Your ecommerce dashboard can tell you how much you’re spending on average on logistics to deliver products to your customers perfectly and on time. Costs here can include packaging, shipping, cost of goods sold, warehousing, and other fulfilment costs.
4. Rate of return: By computing the ratio of orders returned to orders delivered, your dashboard can indicate the health of your fulfilment processes. Low order return rates mean saved costs and boosted brand image. By regularly tracking this metric, you can investigate high return rates quickly, optimize fulfilment, improve customer satisfaction, and take fraud prevention initiatives.
5. Average order cycle time: An important step towards improved fulfilment and increased customer satisfaction is computing the average time taken to ship out an order from the time it was placed. Delayed order cycle times can enable you to investigate issues in the supply chain and rectify them at the earliest.
Read Next: 5 Ways to Increase the Profitability of Your Ecommerce Business
Customer Service
Customer service has an incredibly far-reaching impact on the growth of your business. Good customer service can help you save significantly high acquisition costs, drive customer loyalty, bring in more business, and help your brand stand out in the market.
Here are some critical customer service KPIs your ecommerce dashboard can measure and relay information about.

1. Ticket volume: Your ecommerce dashboard can tell you how many of your customers need help. This metric can be further taken up with customer service teams to get deeper insights. By understanding the nature of support tickets raised, and combining that data with other dashboard metrics, you can work towards optimizing processes.
2. Resolution percentage: The percentage of customer concerns and queries resolved is an indicator of the performance of your customer service team. By computing the ratio of tickets raised to conversations closed, you can evaluate your support teams and take action to optimize the ticket resolution ratio.
3. Average resolution time: Your customers’ griefs are being resolved. But are they being resolved fast enough to augment customer satisfaction? Long resolution times for first contact and follow-ups can be detrimental to customer experience and indicates poorly performing support teams. Your dashboard can track this metric and help you identify concerning trends.
4. Reply rate: Are your customer support staff spending an inordinate amount of time resolving customer queries and complaints? Your ecommerce dashboard can compute the average or median reply rate for all tickets raised, enabling you to take action such as templating replies, altering staffing schedules at peak volumes, redirecting customers to helpful resources, and more.
5. Customer Satisfaction Score: Customer Satisfaction Score (CSAT) measures customer satisfaction with a business, purchase, or interaction. By calculating and updating the overall CSAT for your business, you can keep track of the health of your entire operation and take proactive measures for improvement.
Must Read: Augmented Reality in Retail: Key Benefits and Use-Cases
Build a powerful ecommerce dashboard that’s right for you
Many ecommerce companies use freemium analytics tools to gain insight into store operations and customer experience. While some of these tools are powerful and truly facilitate intelligent decision-making, they may be rigid in their offerings, may not meet your specific business objectives, and can strain your budget.
We can help you build a comprehensive ecommerce dashboard for your business that puts all business-critical data at your fingertips, and visualizes information so you and your teams don’t waste time sorting through huge volumes of scattered data.
Your custom ecommerce dashboard will let you mix and match data from any phase of your customer journey and generate actionable insights through detailed reports.
Interested in building an advanced, feature-rich ecommerce dashboard tailored to your business needs? Give our solutions expert a call today!
Read Next: 10 Essential Ecommerce Website Features To Take Your Digital Store To The Next Level